Scaling Concurrent Transactions
On this page, you'll observe horizontal scale-out and scale-in in action. In particular, you’ll see how in YugabyteDB, you can add nodes to scale your cluster up very efficiently and reliably in order to achieve more read and write IOPS (input/output operations per second). In this tutorial, you will look at how YugabyteDB can scale while a workload is running. You will run a read-write workload using the prepackaged YugabyteDB workload generator against a 3-node local cluster with a replication factor of 3, and add nodes to it while the workload is running. Next, you can observe how the cluster scales out by verifying that the number of read and write IOPS are evenly distributed across all the nodes at all times.
This tutorial uses the yugabyted cluster management utility.
1. Create universe
Start a new three-node cluster with a replication factor (RF) of 3 and set the number of shards (also called tablets) per table per YB-TServer to 4 so that you can better observe the load balancing during scale-up and scale-down.
Create the first node:
$ ./bin/yugabyted start \
                  --base_dir=/tmp/ybd1 \
                  --listen=127.0.0.1 \
                  --master_flags "ysql_num_shards_per_tserver=4" \
                  --tserver_flags "ysql_num_shards_per_tserver=4,follower_unavailable_considered_failed_sec=30"
Add 2 more nodes to this cluster by joining them with the previous node:
$ ./bin/yugabyted start \
                  --base_dir=/tmp/ybd2 \
                  --listen=127.0.0.2 \
                  --join=127.0.0.1 \
                  --master_flags "ysql_num_shards_per_tserver=4" \
                  --tserver_flags "ysql_num_shards_per_tserver=4,follower_unavailable_considered_failed_sec=30"
$ ./bin/yugabyted start \
                  --base_dir=/tmp/ybd3 \
                  --listen=127.0.0.3 \
                  --join=127.0.0.1 \
                  --master_flags "ysql_num_shards_per_tserver=4" \
                  --tserver_flags "ysql_num_shards_per_tserver=4,follower_unavailable_considered_failed_sec=30"
ysql_num_shards_per_tserverdefines the number of shards of a table that one node will have. This means that for our example above, a table will have a total of 12 shards across all the 3 nodes combined.follower_unavailable_considered_failed_secsets the time after which other nodes consider an inactive node to be unavailable and remove it from the cluster.
Each table now has four tablet-leaders in each YB-TServer and with a replication factor (RF) of 3; there are two tablet-followers for each tablet-leader distributed in the two other YB-TServers. So each YB-TServer has 12 tablets (that is, the sum of 4 tablet-leaders plus 8 tablet-followers) per table.
2. Run the YugabyteDB workload generator
Download the YugabyteDB workload generator JAR file (yb-sample-apps.jar).
$ wget https://github.com/yugabyte/yb-sample-apps/releases/download/1.3.9/yb-sample-apps.jar?raw=true -O yb-sample-apps.jar
Run the SqlInserts workload app against the local universe using the following command.
$ java -jar ./yb-sample-apps.jar --workload SqlInserts \
                                 --nodes 127.0.0.1:5433 \
                                 --num_threads_write 1 \
                                 --num_threads_read 4
The workload application prints some statistics while running, an example is shown here. You can read more details about the output of the sample applications here.
2018-05-10 09:10:19,538 [INFO|...] Read: 8988.22 ops/sec (0.44 ms/op), 818159 total ops  |  Write: 1095.77 ops/sec (0.91 ms/op), 97120 total ops  | ...
2018-05-10 09:10:24,539 [INFO|...] Read: 9110.92 ops/sec (0.44 ms/op), 863720 total ops  |  Write: 1034.06 ops/sec (0.97 ms/op), 102291 total ops  | ...
3. Observe IOPS per node
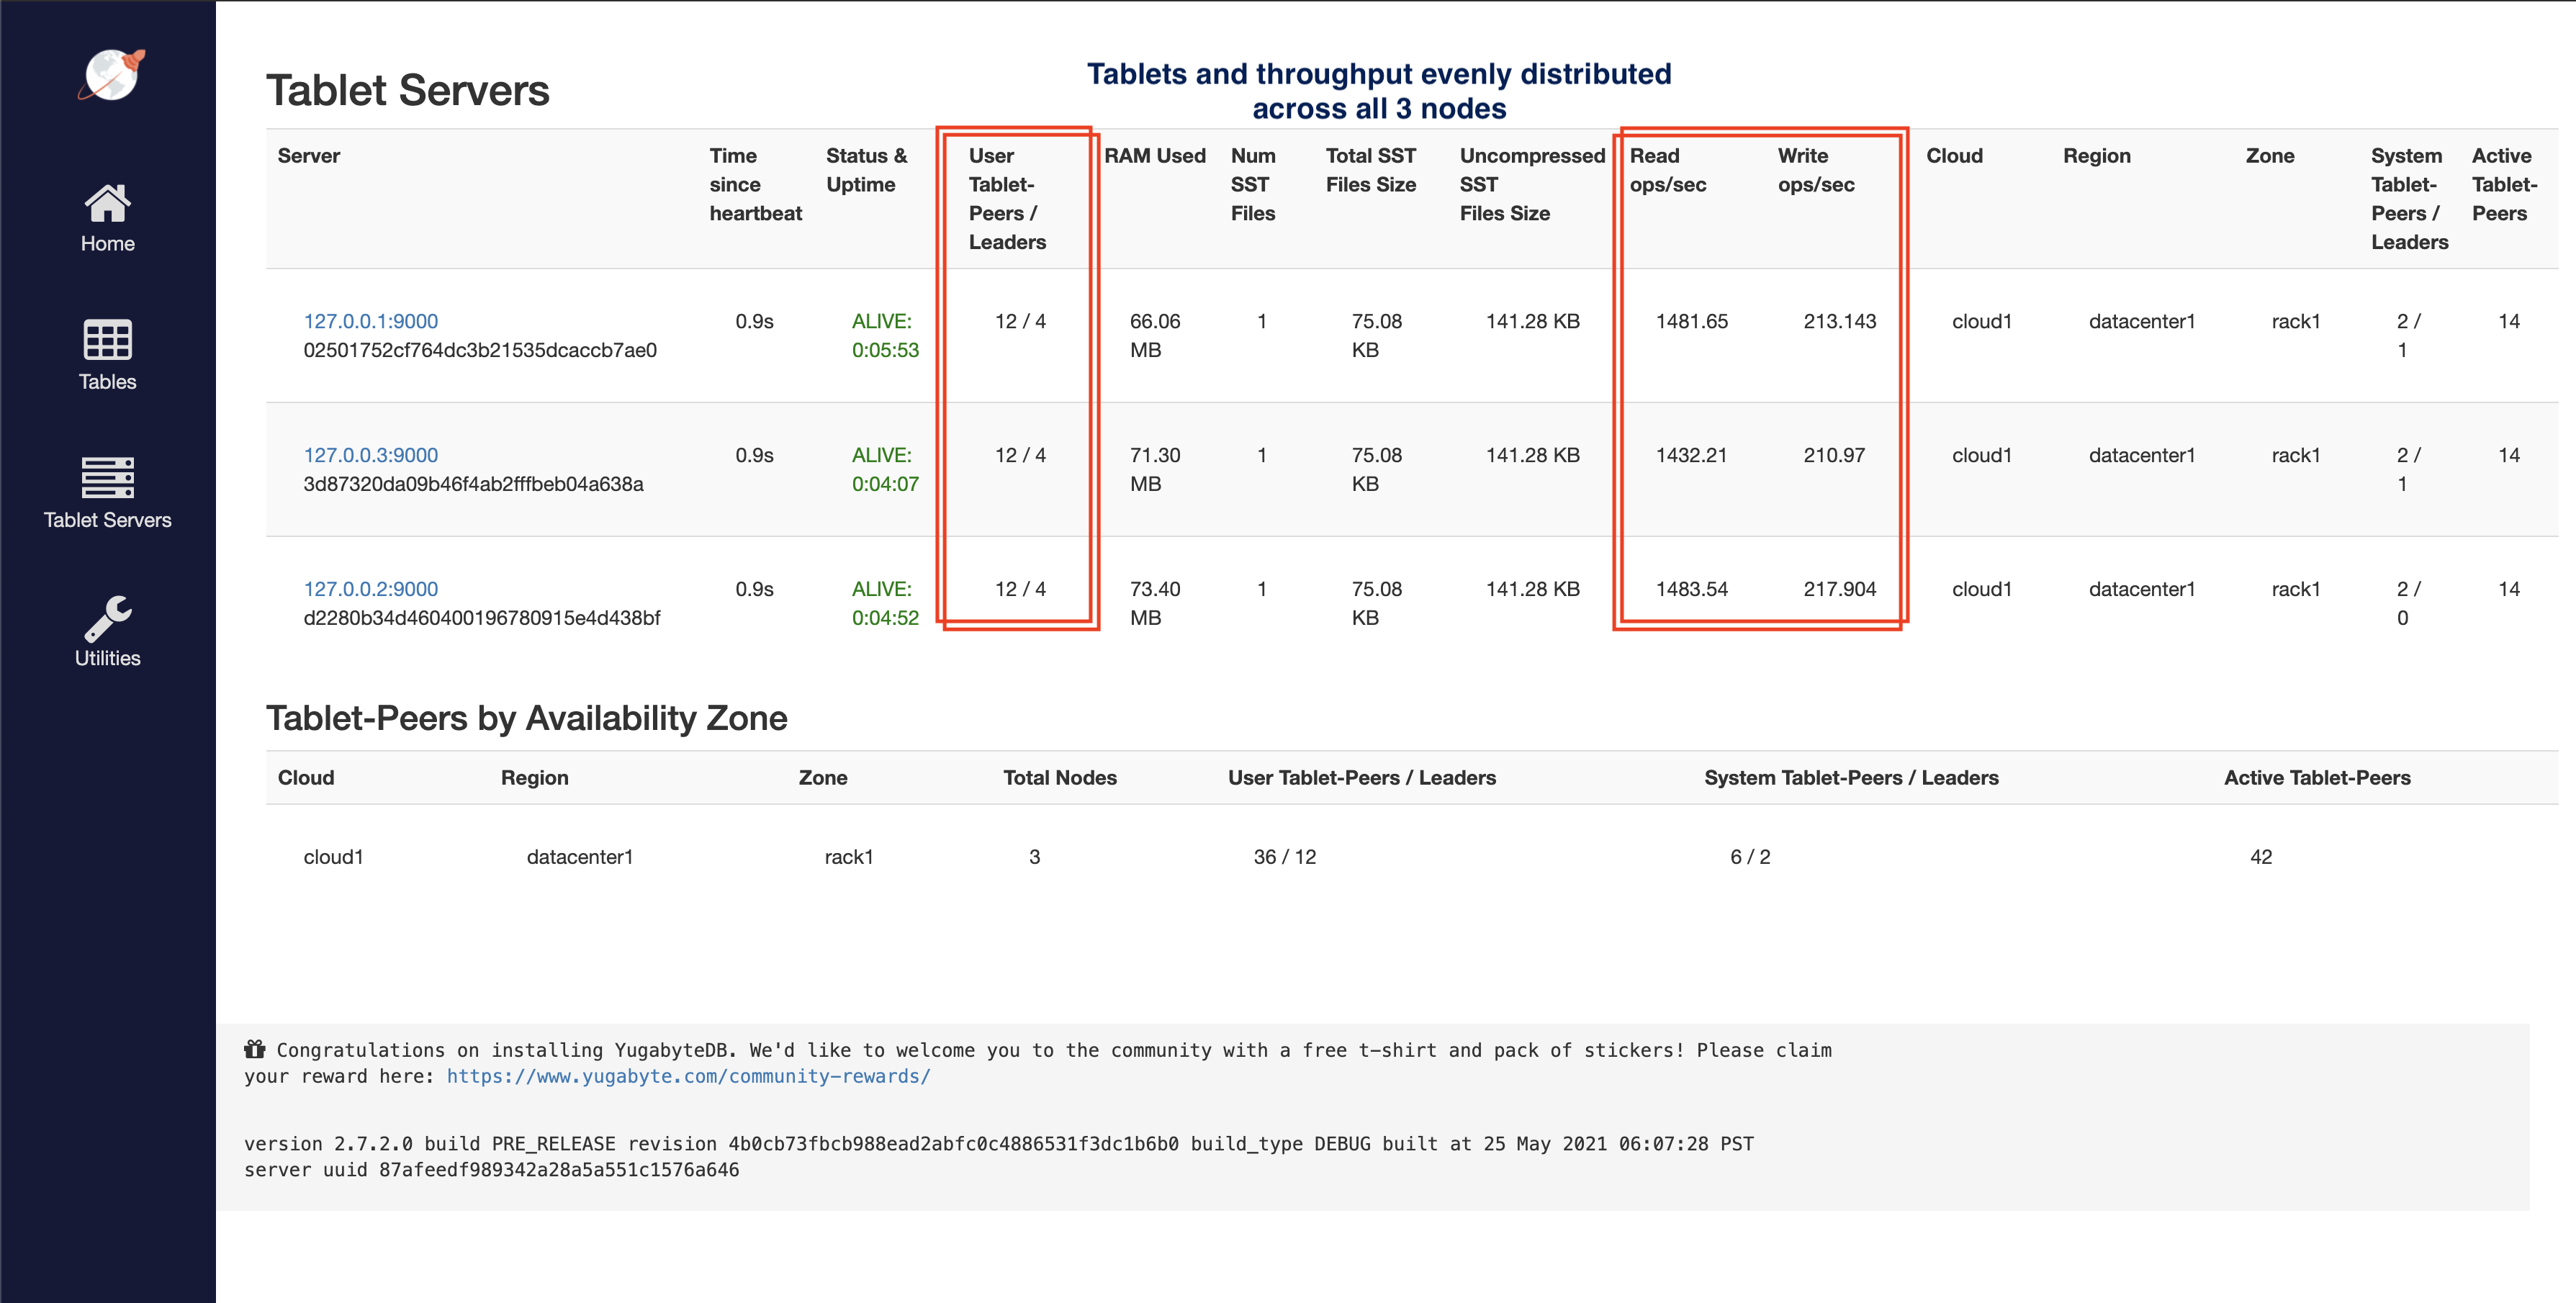
You can check a lot of the per-node stats by browsing to the tablet-servers page. It should look like this. The total read and write IOPS per node are highlighted in the screenshot below. Note that both the reads and the writes are roughly the same across all the nodes indicating uniform usage across the nodes.
4. Add node and observe linear scaling
Add a node to the universe with the same flags.
$ ./bin/yugabyted start \
                  --base_dir=/tmp/ybd4 \
                  --listen=127.0.0.4 \
                  --join=127.0.0.1 \
                  --master_flags "ysql_num_shards_per_tserver=4" \
                  --tserver_flags "ysql_num_shards_per_tserver=4,follower_unavailable_considered_failed_sec=30"
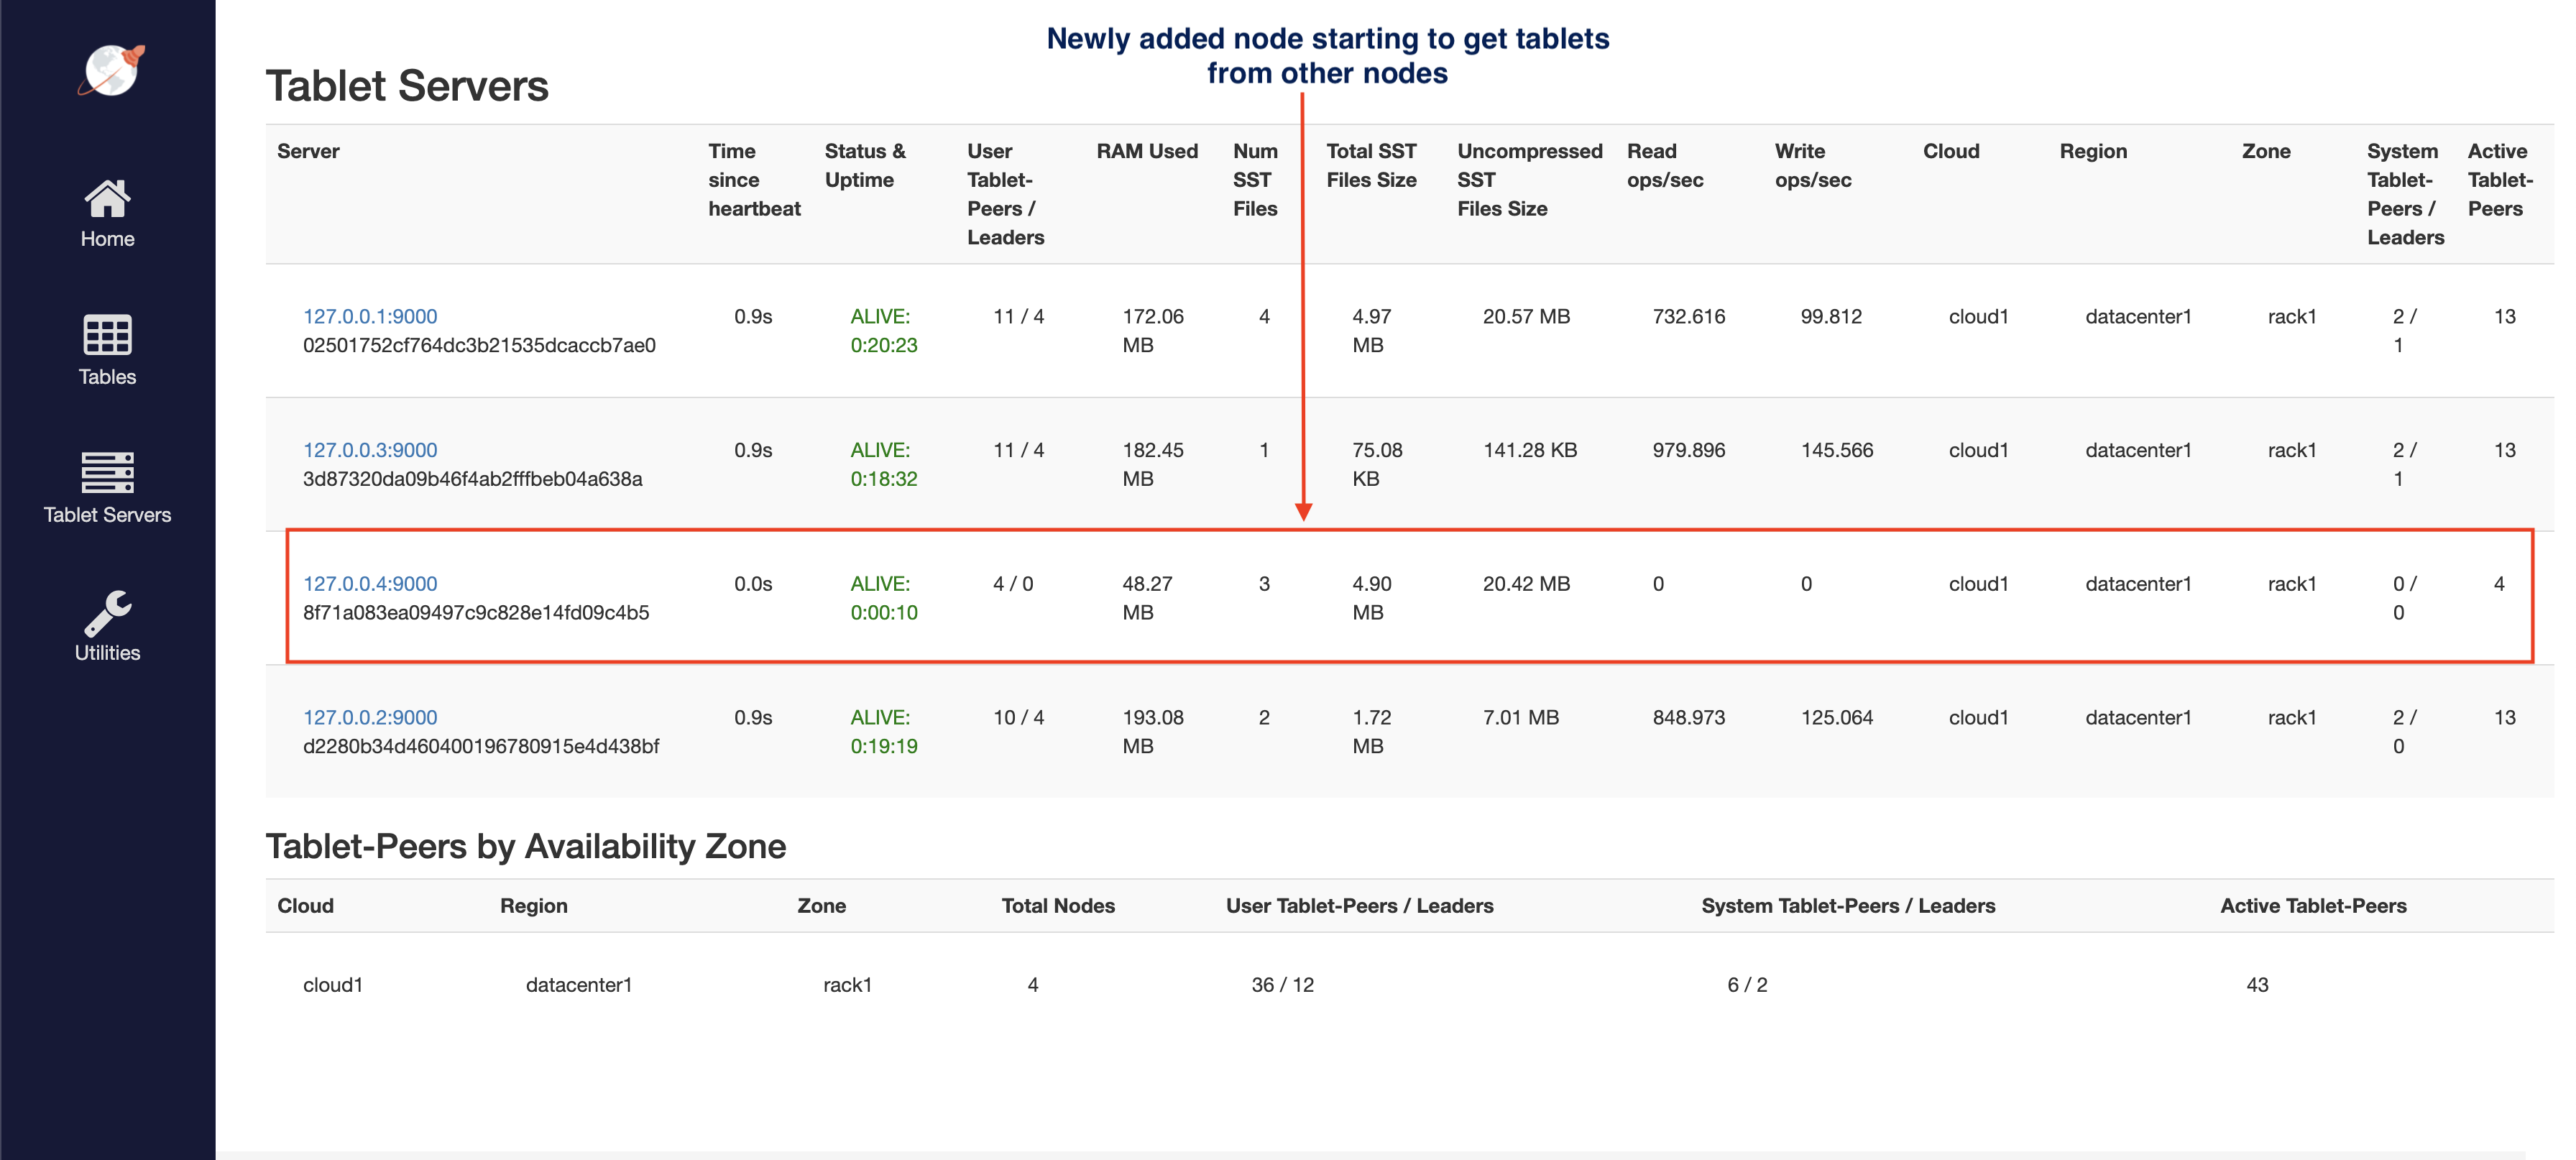
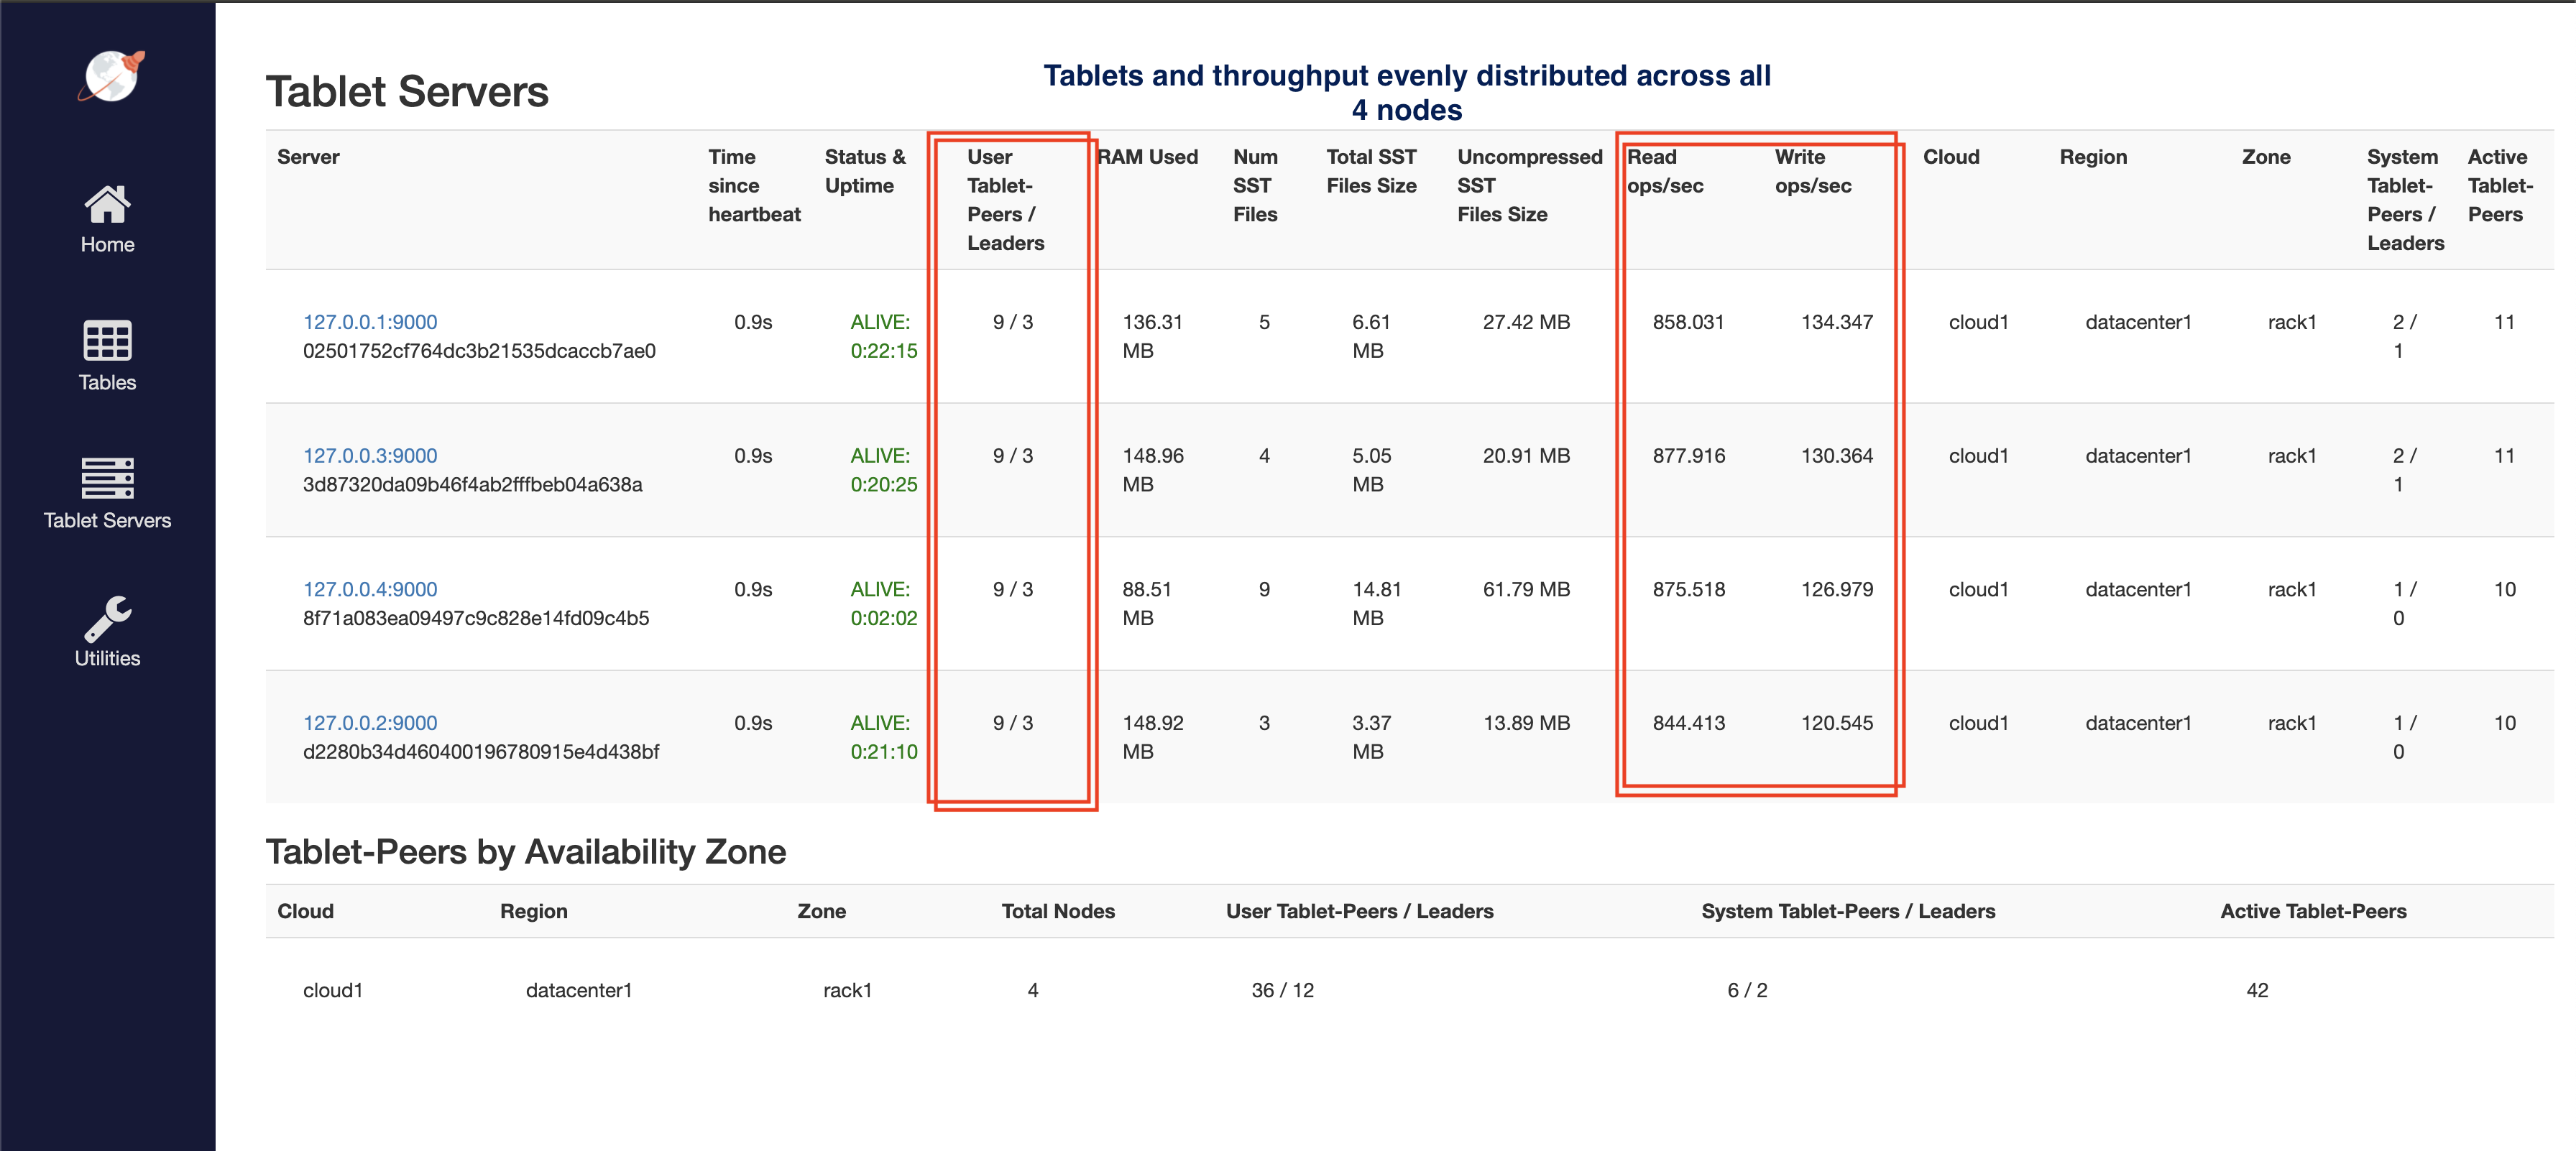
Now you should have 4 nodes. Refresh the tablet-servers page to see the statistics update. Shortly, you should see the new node performing a comparable number of reads and writes as the other nodes. The 36 tablets will now get distributed evenly across all the 4 nodes, leading to each node having 9 tablets.
The YugabyteDB universe automatically lets the client know to use the newly added node for serving queries. This scaling out of client queries is completely transparent to the application logic, allowing the application to scale linearly for both reads and writes.
5. Remove node and observe linear scale in
Remove the recently added node from the universe.
$ ./bin/yugabyted stop \
                  --base_dir=/tmp/ybd4
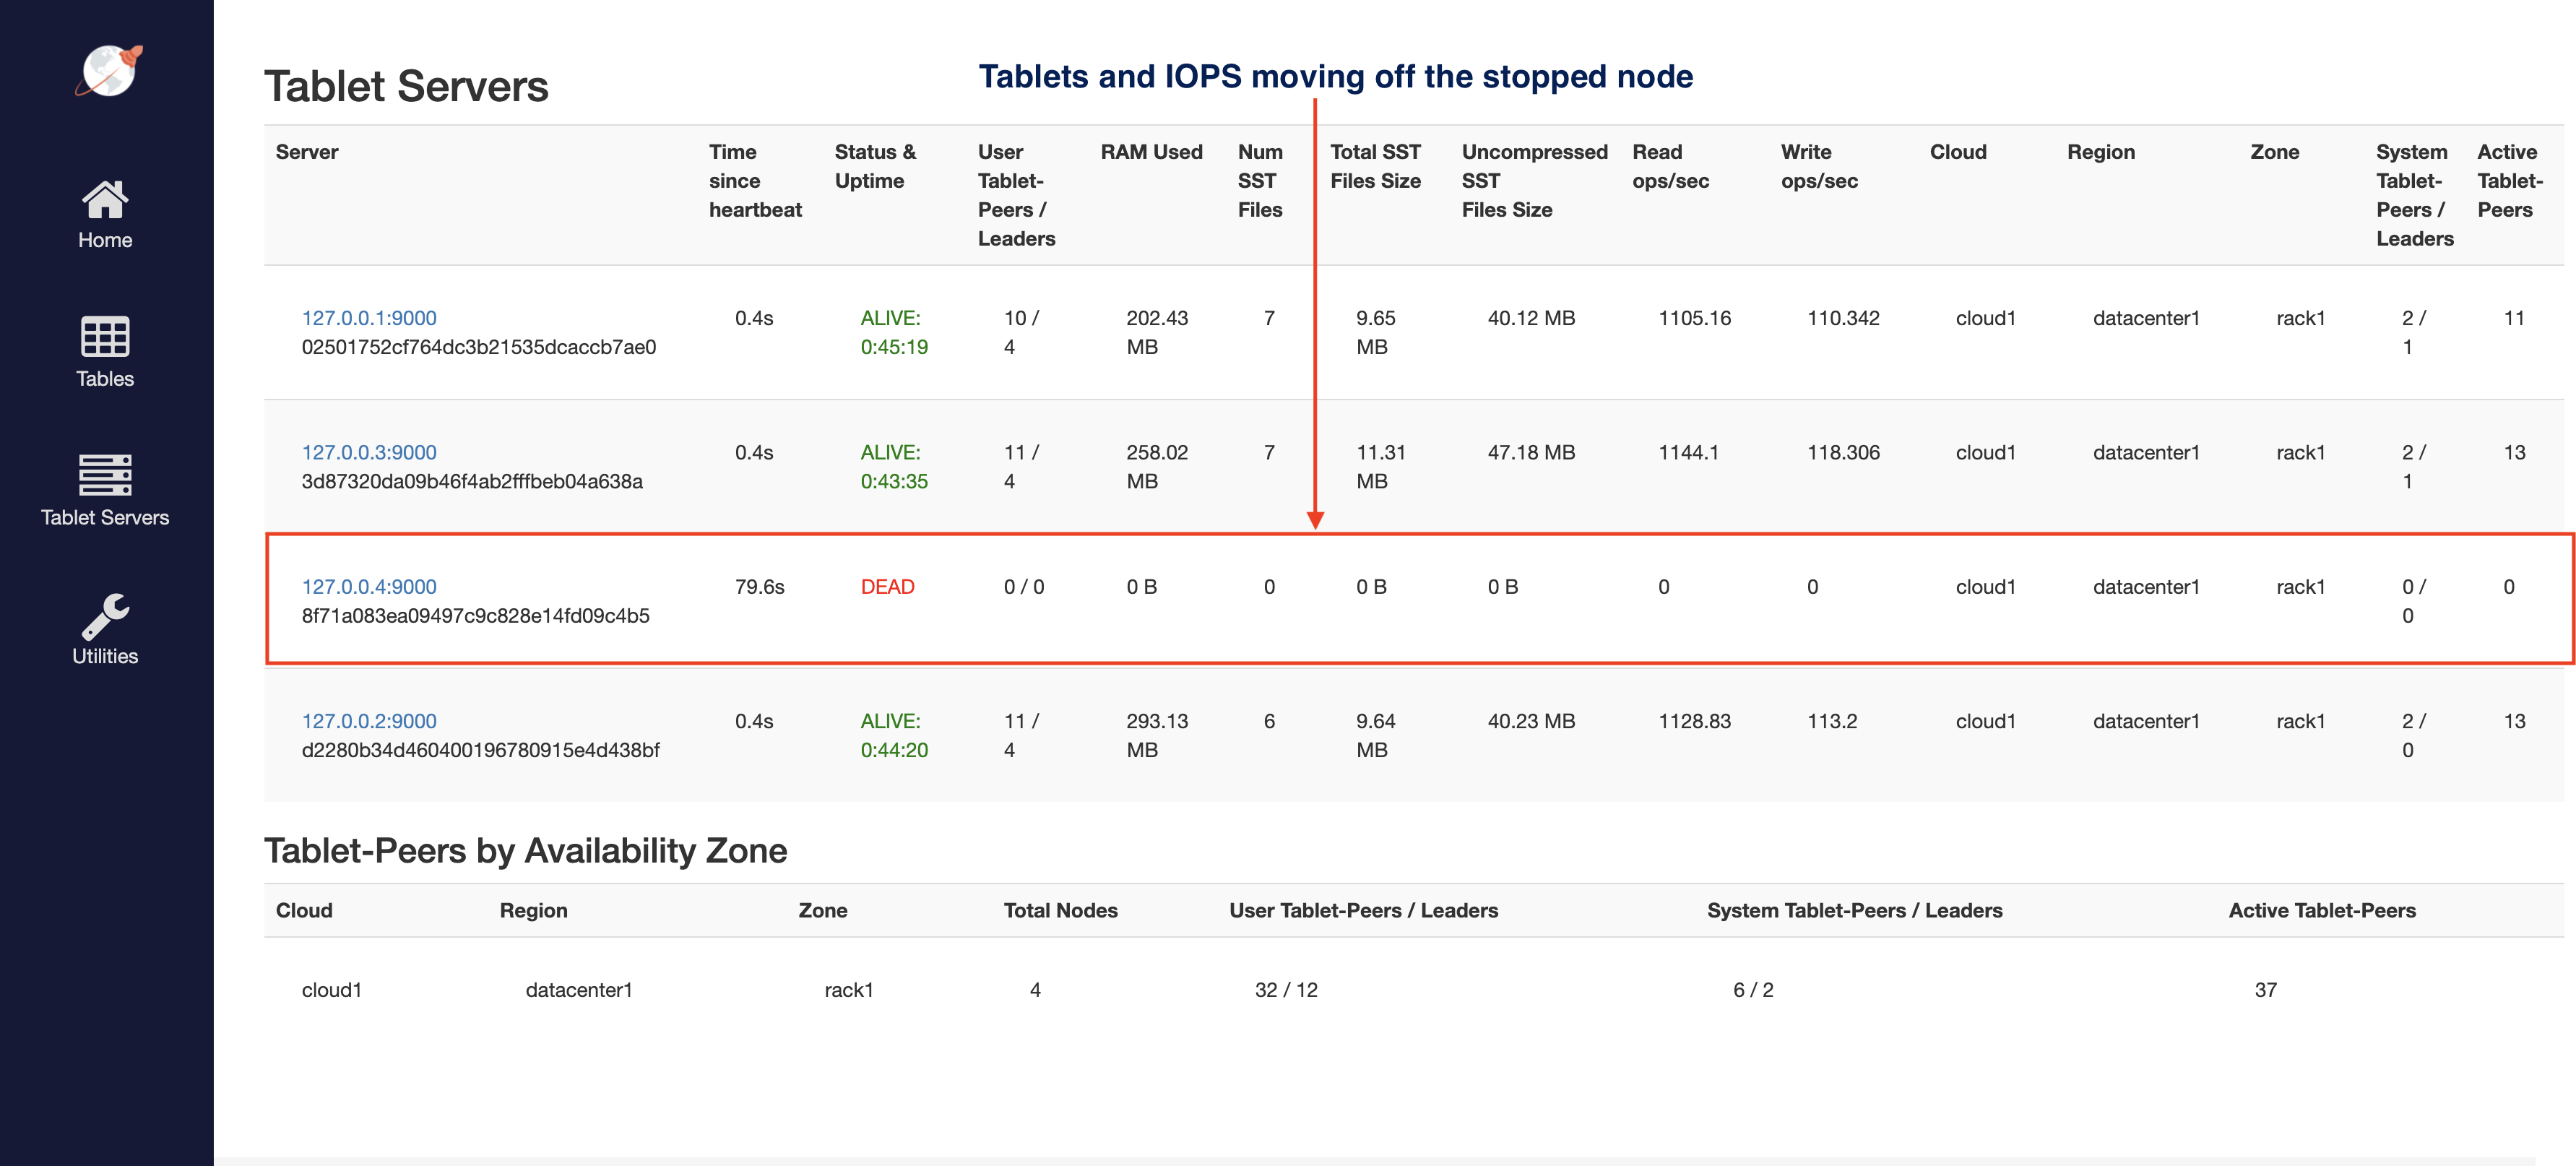
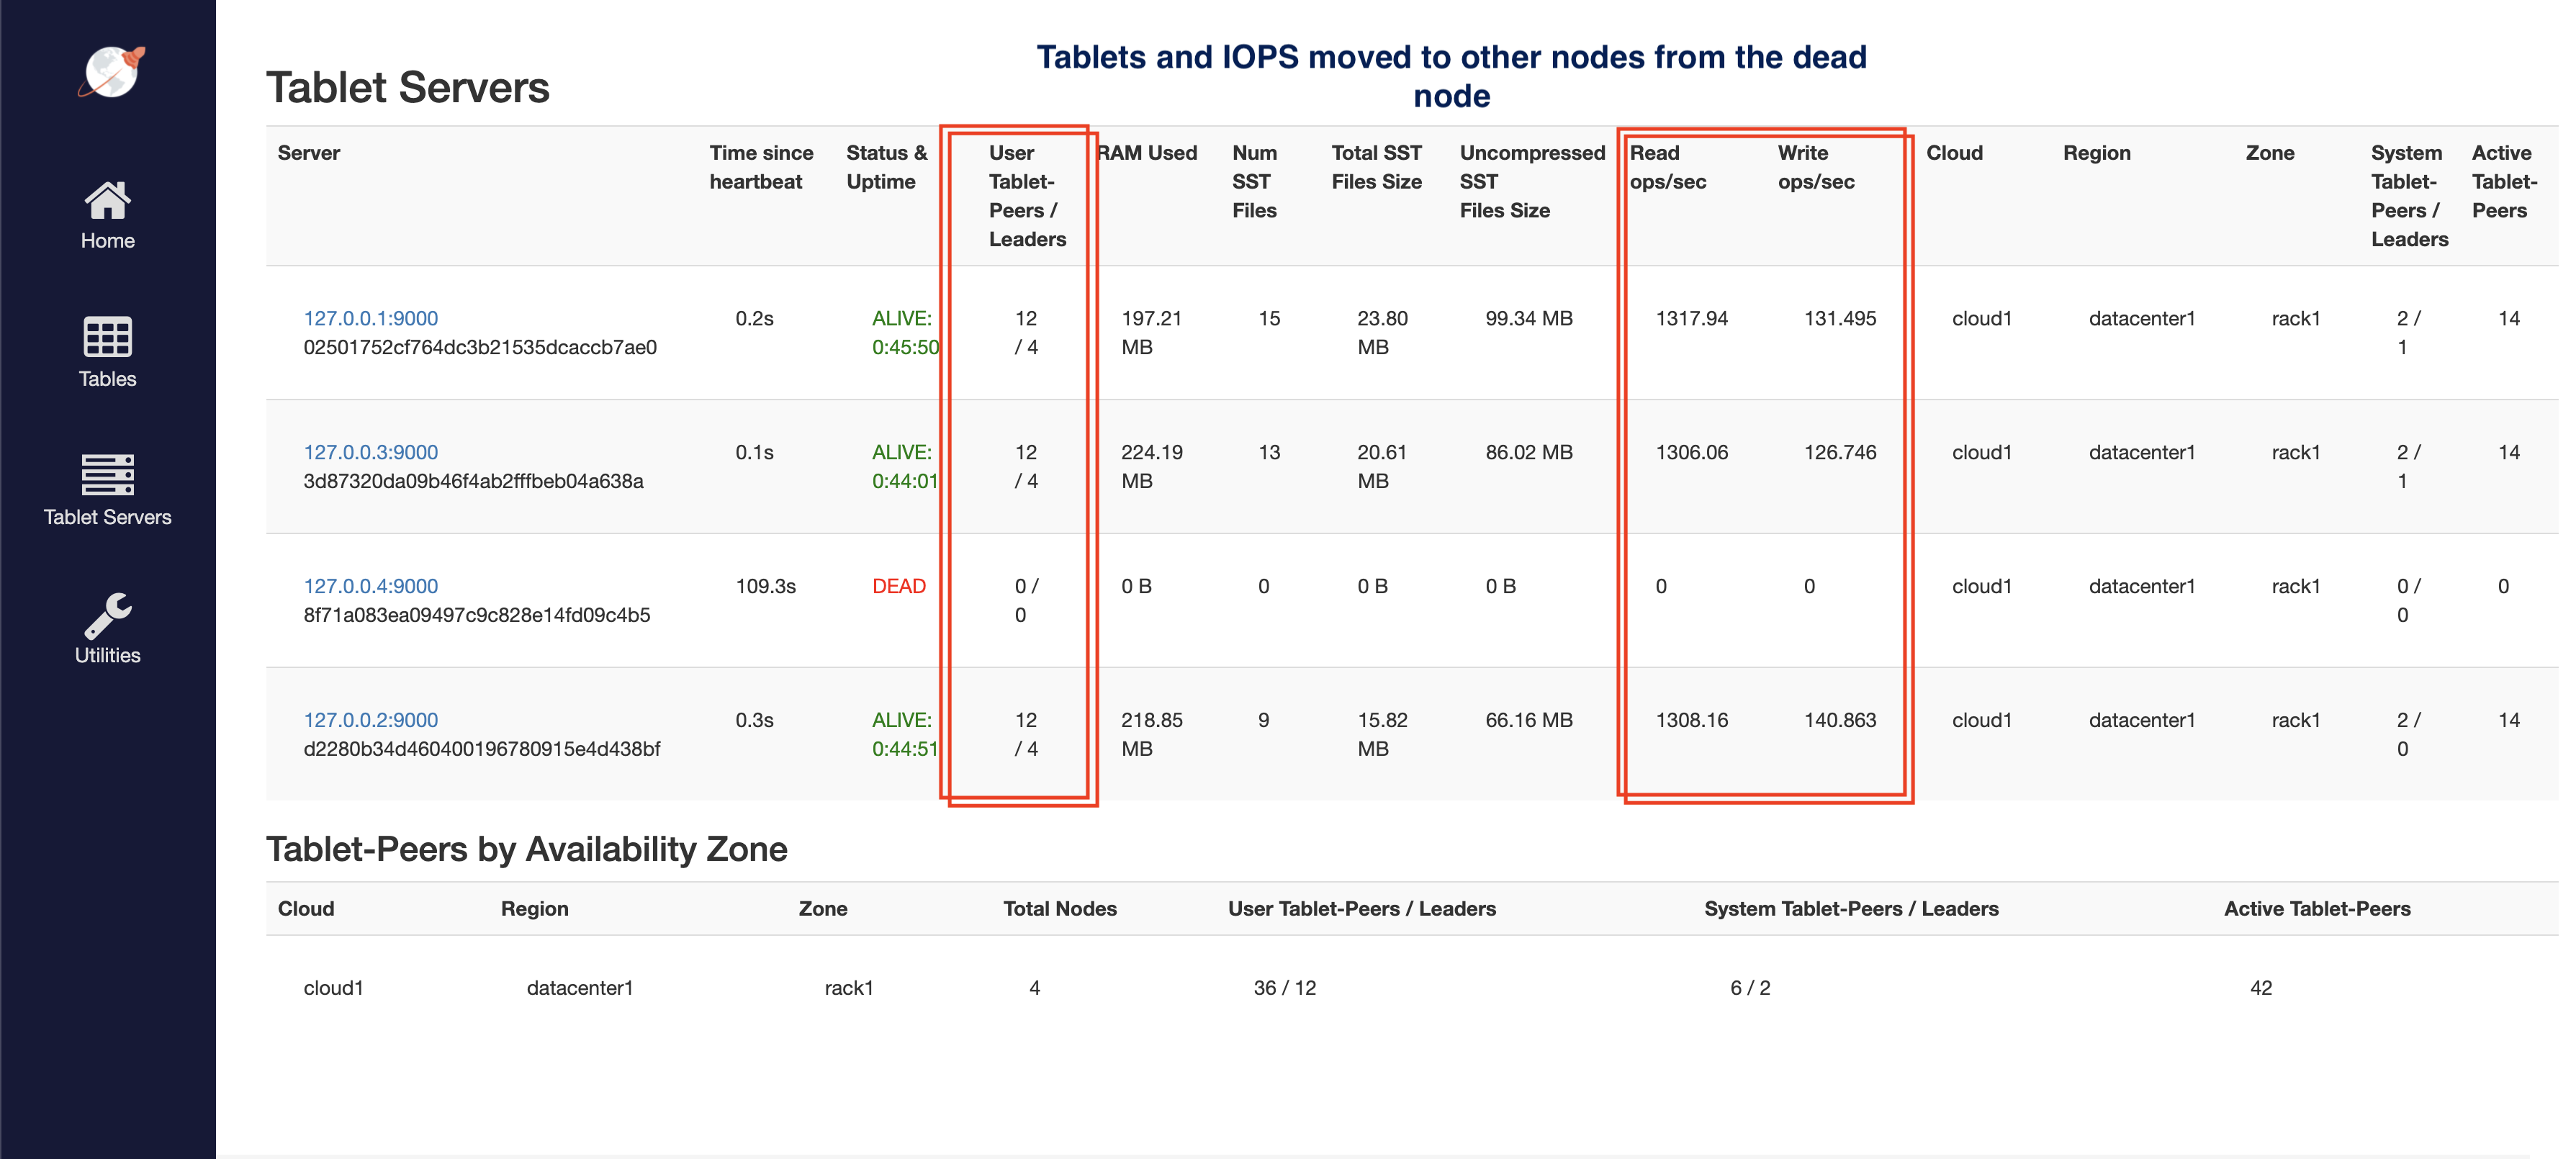
Refresh the tablet-servers page to see the stats update. The Time since heartbeat value for that node will keep increasing. Once that number reaches 60s (i.e. 1 minute), YugabyteDB will change the status of that node from ALIVE to DEAD. Observe the load (tablets) and IOPS getting moved off the removed node and redistributed amongst the other nodes.
6. Clean up (optional)
Optionally, you can shut down the local cluster you created earlier.
$ ./bin/yugabyted destroy \
                  --base_dir=/tmp/ybd1
$ ./bin/yugabyted destroy \
                  --base_dir=/tmp/ybd2
$ ./bin/yugabyted destroy \
                  --base_dir=/tmp/ybd3
$ ./bin/yugabyted destroy \
                  --base_dir=/tmp/ybd4