Fault tolerance
YugabyteDB can automatically handle failures and therefore provides high availability. In this section, you'll see how YugabyteDB can continue to do reads and writes even in case of node failures. You will create YSQL tables with a replication factor (RF) of 3 that allows a fault tolerance of 1. This means the cluster will remain available for both reads and writes even if one node fails. However, if another node fails bringing the number of failures to two, then writes will become unavailable on the cluster in order to preserve data consistency.
This tutorial uses the yugabyted cluster management utility.
1. Create a universe
Start a new local three-node cluster with a replication factor of 3. First create a single node cluster.
./bin/yugabyted start \
                --listen=127.0.0.1 \
                --base_dir=/tmp/ybd1
Next, create a 3 node cluster by joining two more nodes with the previous node. By default, yugabyted creates a cluster with a replication factor of 3 on starting a 3 node cluster.
./bin/yugabyted start \
                --listen=127.0.0.2 \
                --base_dir=/tmp/ybd2 \
                --join=127.0.0.1
./bin/yugabyted start \
                --listen=127.0.0.3 \
                --base_dir=/tmp/ybd3 \
                --join=127.0.0.1
2. Run the sample key-value app
Download the YugabyteDB workload generator JAR file (yb-sample-apps.jar).
$ wget https://github.com/yugabyte/yb-sample-apps/releases/download/1.3.9/yb-sample-apps.jar?raw=true -O yb-sample-apps.jar
Run the SqlInserts workload against the local universe using the following command.
$ java -jar ./yb-sample-apps.jar --workload SqlInserts \
                                 --nodes 127.0.0.1:5433 \
                                 --num_threads_write 1 \
                                 --num_threads_read 4
The SqlInserts workload prints some statistics while running, which is also shown below. You can read more details about the output of the workload applications at the YugabyteDB workload generator.
32001 [Thread-1] INFO com.yugabyte.sample.common.metrics.MetricsTracker  - Read: 4508.59 ops/sec (0.88 ms/op), 121328 total ops  |  Write: 658.11 ops/sec (1.51 ms/op), 18154 total ops  |  Uptime: 30024 ms | ...
37006 [Thread-1] INFO com.yugabyte.sample.common.metrics.MetricsTracker  - Read: 4342.41 ops/sec (0.92 ms/op), 143061 total ops  |  Write: 635.59 ops/sec (1.58 ms/op), 21335 total ops  |  Uptime: 35029 ms | ...
3. Observe even load across all nodes
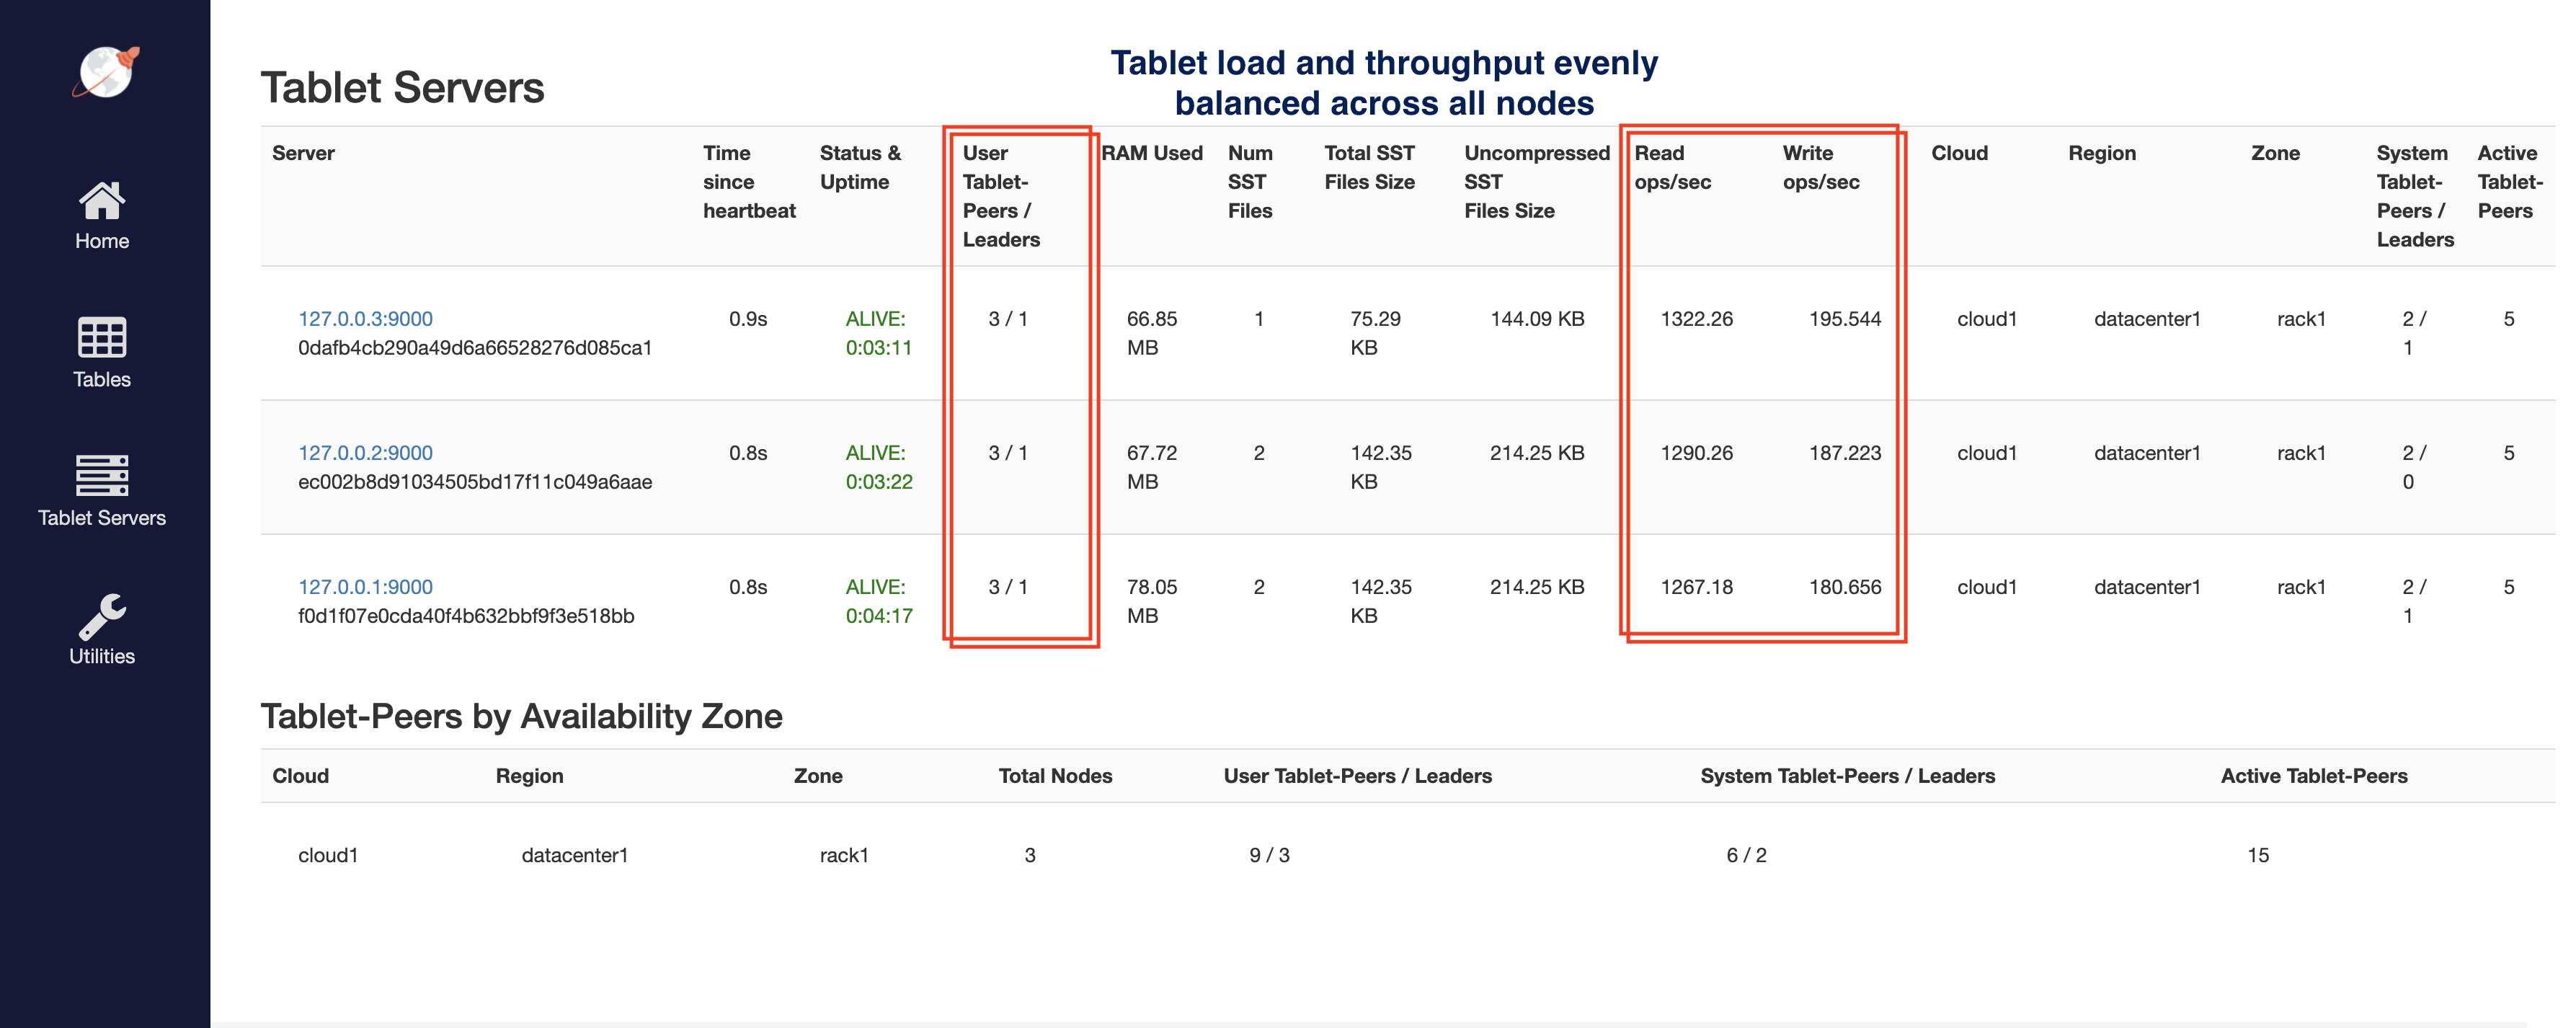
You can check a lot of the per-node statistics by browsing to the tablet-servers page. It should look like this. The total read and write IOPS per node are highlighted in the screenshot below. Note that both the reads and the writes are roughly the same across all the nodes indicating uniform usage across the nodes.

4. Remove a node and observe continuous write availability
Remove a node from the universe.
$ ./bin/yugabyted stop \
                  --base_dir=/tmp/ybd3
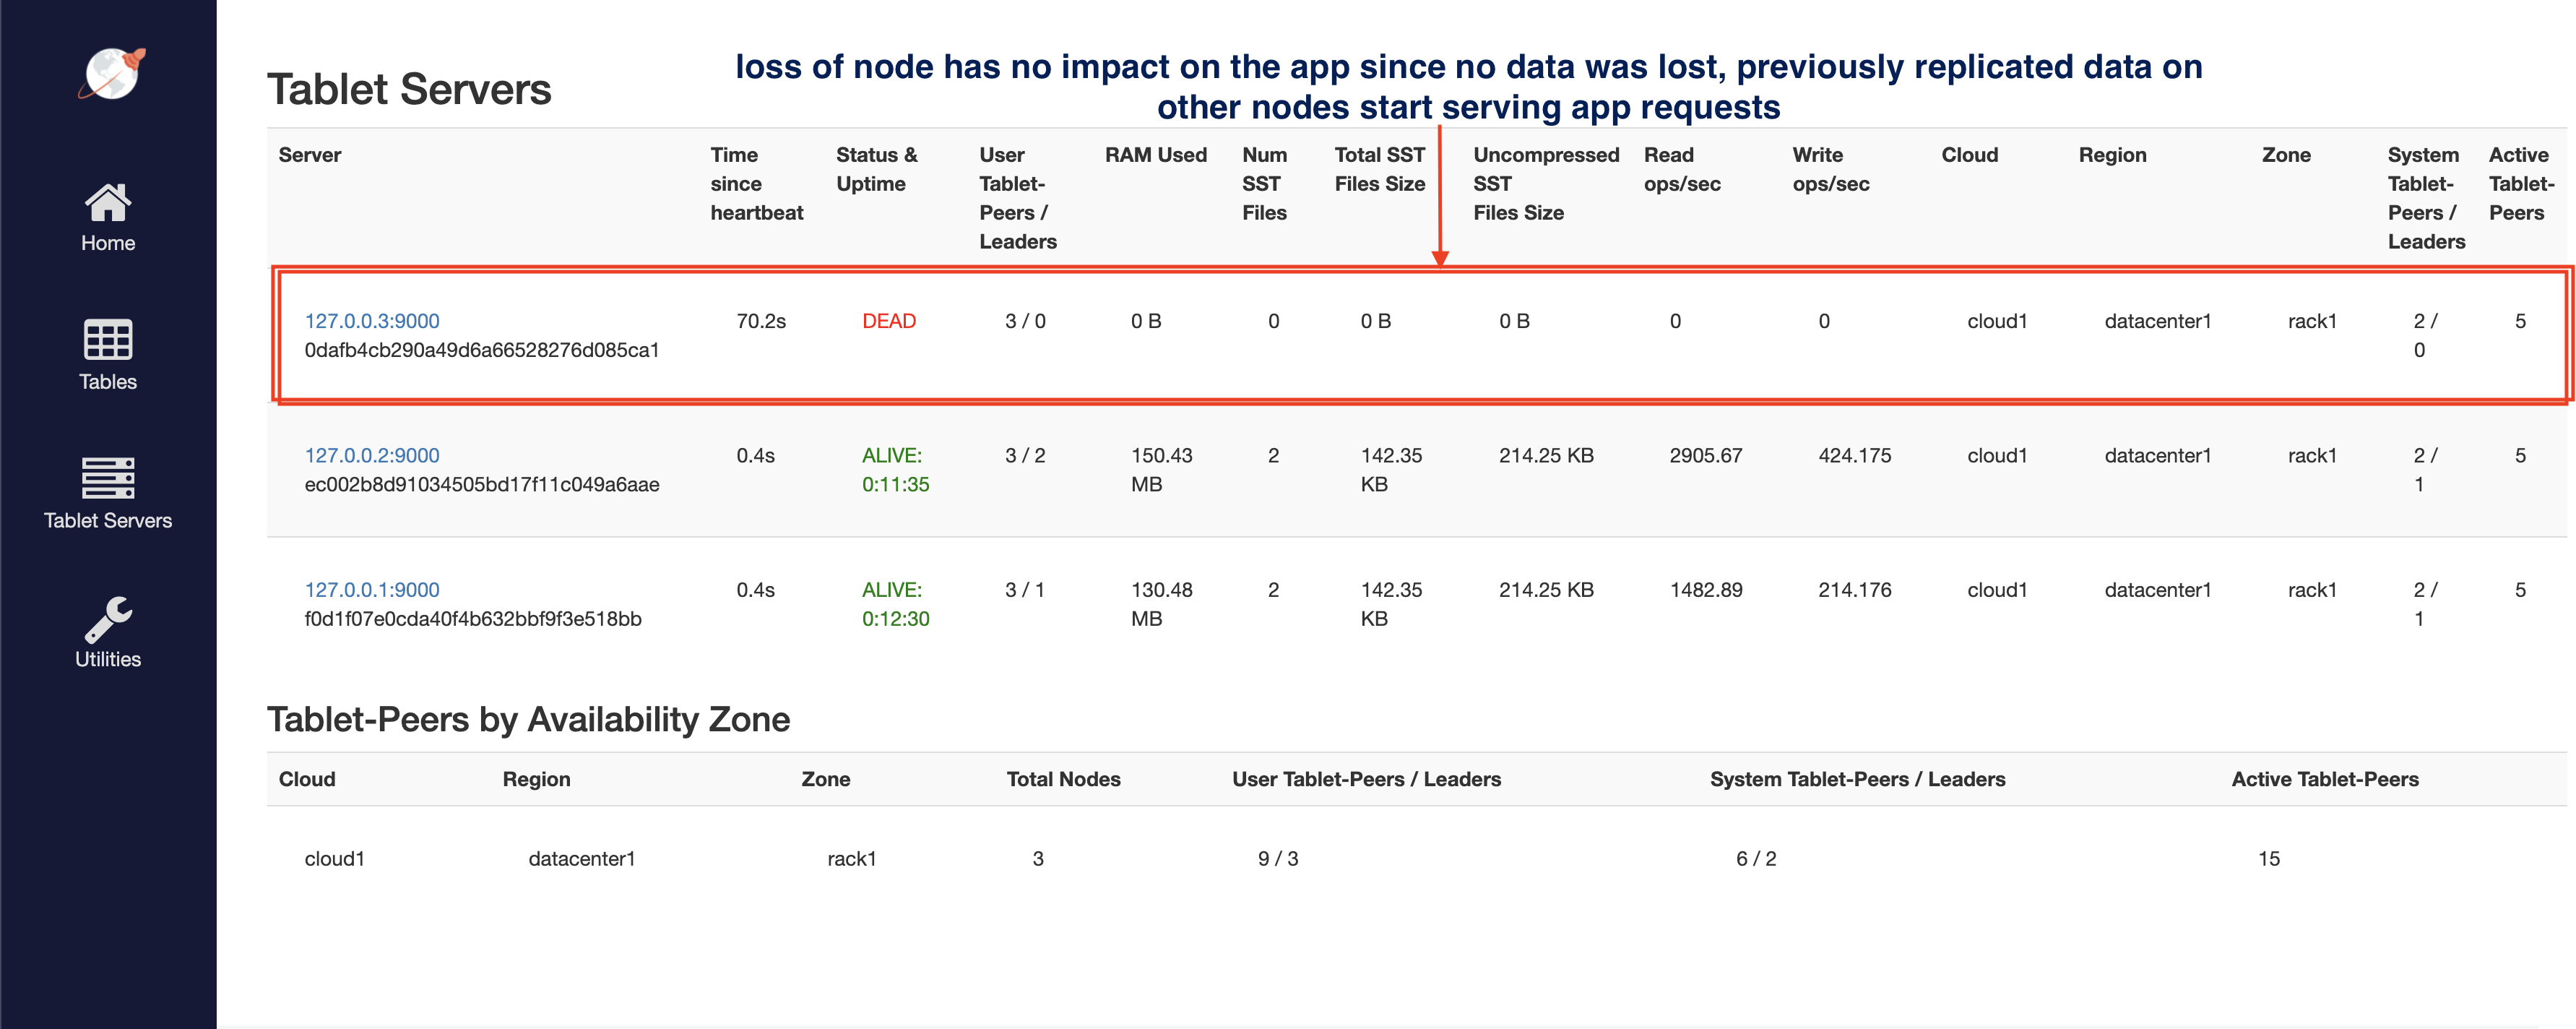
Refresh the tablet-servers page to see the stats update. The Time since heartbeat value for that node will keep increasing. Once that number reaches 60s (1 minute), YugabyteDB will change the status of that node from ALIVE to DEAD. Note that at this time the universe is running in an under-replicated state for some subset of tablets.

6. [Optional] Clean up
Optionally, you can shut down the local cluster you created earlier.
$ ./bin/yugabyted destroy \
                  --base_dir=/tmp/ybd1
$ ./bin/yugabyted destroy \
                  --base_dir=/tmp/ybd2
$ ./bin/yugabyted destroy \
                  --base_dir=/tmp/ybd3