Scaling YCQL queries
As a part of our efforts to push the limits of the systems you build, Yugabyte ran some large cluster benchmarks to scale YugabyteDB to million of reads and writes per second while retaining low latencies. This topic covers the details about our 50-node cluster benchmarks. Results of the earlier benchmark tests performed on a 25-node cluster are available in the Yugabyte Community forum.
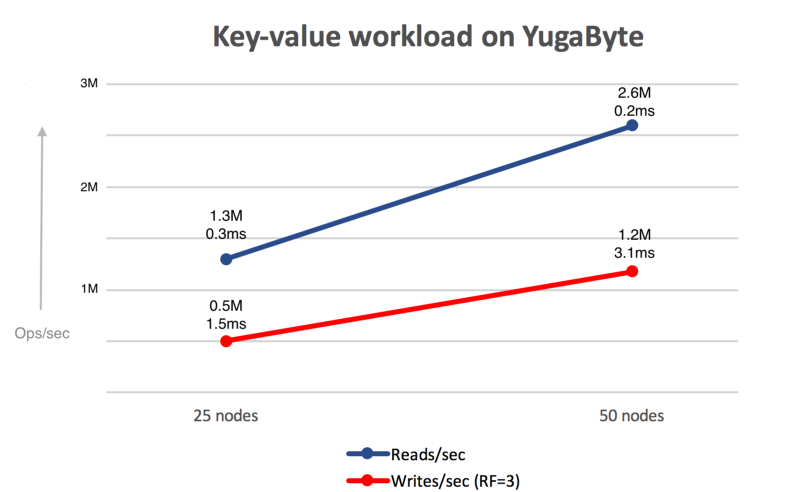 Writes are RF of
 3 with strong consistency, reads are leader-only data strongly consistent reads.
The graph above shows how you can achieve linear scalability with YugabyteDB. The read and write throughput doubles when the cluster size doubles from 25 to 50 nodes, while the latencies remain low in the order of couple milliseconds. For details about how reads and writes work, see YugabyteDB architecture and YugabyteDB IO operations.
This test was performed in Google Cloud Platform (GCP). Since YugabyteDB is a cloud-native database, it can deliver similar performance results on other public clouds and on-premises data centers.
The sections below cover the experimental setup and the details of the read and write performance metrics.
Benchmark setup
- 50 compute instances in Google Cloud Platform
- Each instance is a
n1-standard-16N1 standard machine type with:- 16 virtual CPUs
- Intel® Xeon® CPU @ 2.20GHz
- 60 GB RAM
- 2 x 375 GB direct attached SSD
- Replication factor (RF) =
3 - YugabyteDB version:
0.9.1.0. All configuration flags are default on the YugabyteDB nodes.
The workload was generated using a multi-threaded Cassandra key-value sample application that was run from n1-highcpu-32 machines. The key and value sizes used were 40 and 16 bytes, respectively.
Reads
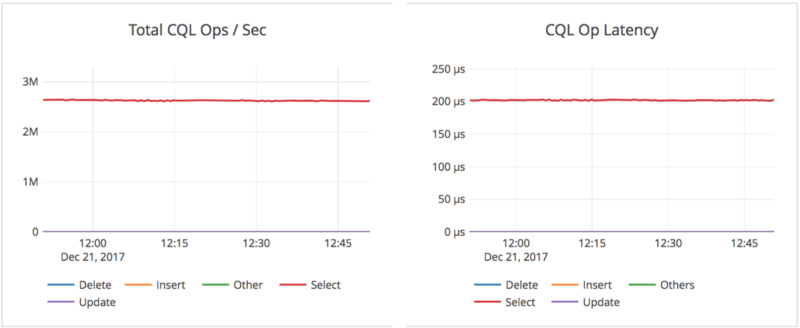
YugabyteDB performs strongly consistent reads by default. For details, see Read IO path (single shard). Below is the summary of the performance metrics observed during a 100% read workload:
- 2.6& million read operations per second, sum across the YugabyteDB nodes.
- 0.2 millisecond average latency per read on the server side.
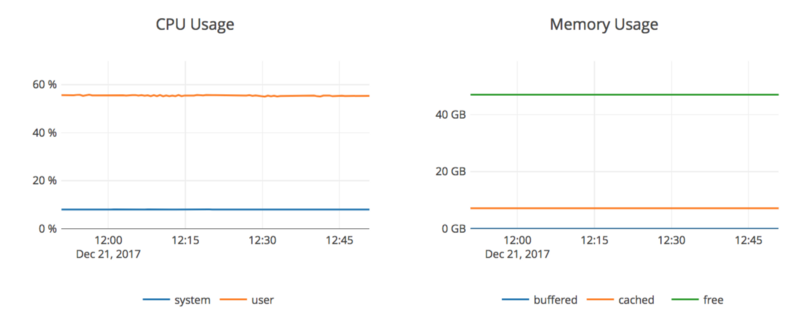
- 65% CPU usage, averaged across the YugabyteDB nodes.
50-node cluster - read IOPS and latency across the nodes
The graphs below were captured for one hour of the run. The operations per second is the sum across all the nodes while the latency is the average. Note that the throughput and latency metrics are very steady over the entire time window.
50-node cluster - CPU and memory during the read benchmark
The two graphs below show the corresponding CPU and memory (RAM) usage during that time interval.
Writes
YugabyteDB performs strongly consistent writes, with a replication factor (RF) of 3 in this case. Here is detailed information of the write IO path in our docs. Below is the summary of the performance metrics observed during a 100% write workload:
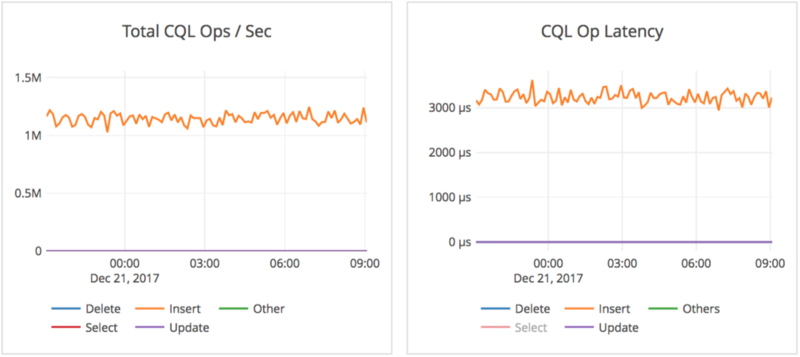
- 1.2 million write operations per second, sum across the YugabyteDB nodes.
- 3.1 millisecond average latency per write operation on the server side.
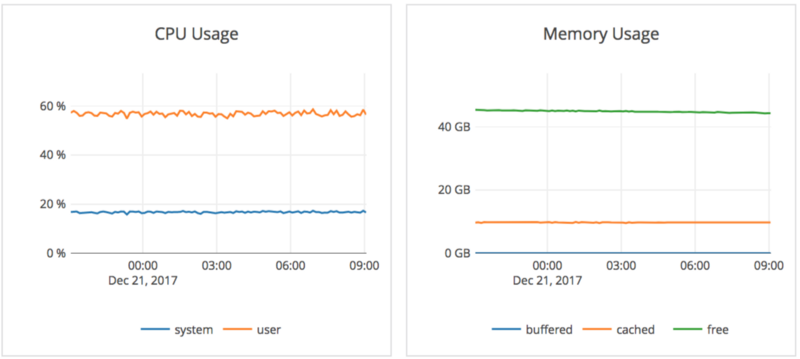
- 75% CPU usage on average across the YugabyteDB nodes.
The graphs below are for twelve hours of the run. Note that this is a much longer time interval than the read benchmark because performance issues in writes often show up after a while of running when latency spikes due to background flushes and compaction start to show up.
50-node cluster — write IOPS and latency across the nodes
The two graphs below are the corresponding CPU and RAM usage for those twelve hours, and are the average across all the YugabyteDB nodes.
50-node cluster — CPU and memory during the write benchmark
Note that these writes are the logical writes that the application issued. Each write is replicated three times internally by the database using the Raft consensus protocol based on the replication factor (RF) of 3.
Next steps
You can visit the YugabyteDB workload generator GitHub repository to try out more experiments on your own local setups. After you set up a cluster and test your favorite application, share your feedback and suggestions with other users on the YugabyteDB Community Slack.